| Our analyses: rational and process |
|
Our global approach (fully available at the PRO, for PROfessionals) is to process and analyse daily the informations coming back from the field. We produce and upgrade daily easy-to-read graphs. The goal is to provide an insight into the potential trends of days, weeks or months of evolution and to provide a background, via a metadata repository, for any change, subtle, overt or violent. We give access to all recorded individuals from a given site since the beginning of any project (the 1st one started in February 2006) thanks to our policy of data stocking. We use dynamic graphs as shown on the public page (Recordings) but at the PRO one can get 1, 4 or 16 clams simultaneously. |
|
|
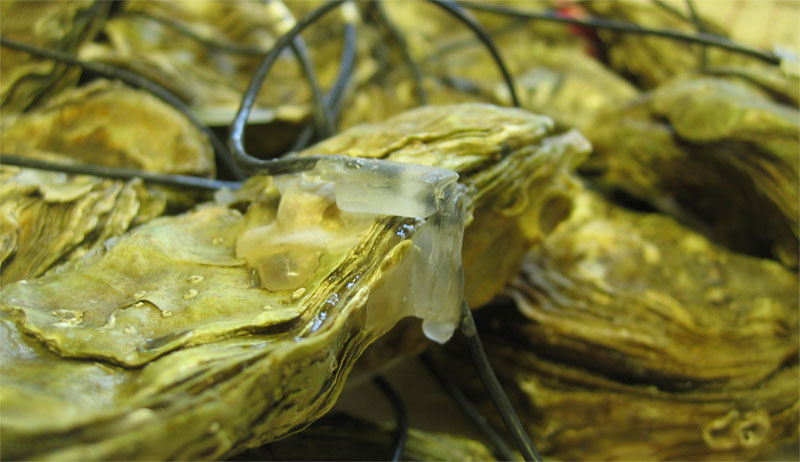
Picture: Mikhail Makarov |
A basic idea is to produce a single mathematical equation for each animal for each day, then to exploit these equations so that the maximum possible amount of "digested" data can be obtained graphically. The PRO also allows inter site comparisons. In the pages of MolluSCAN eye PRO, professionals can integrate various type of information and produce derived graphics describing the various aspect of the clams ethology, chronobiology or physiology. The graphs allow to place the relevance of single observations in a broader context of comprehensive behavior. One can find below four key examples of what we produce: biological rhythms, growth rates and spawning or death records. (get a poster on this and a review paper). |
|
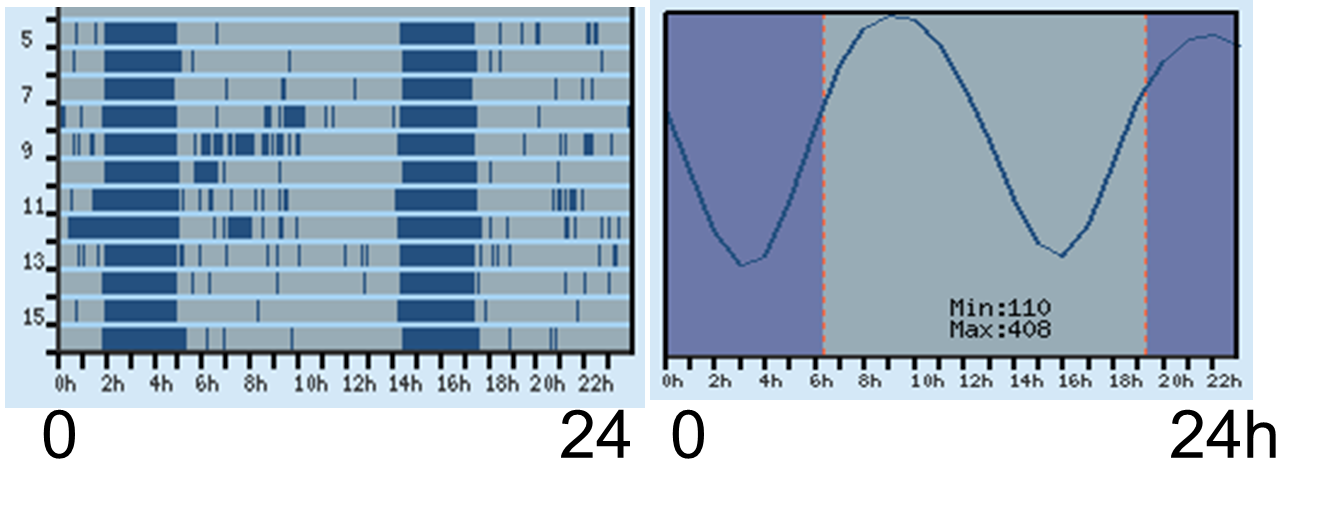
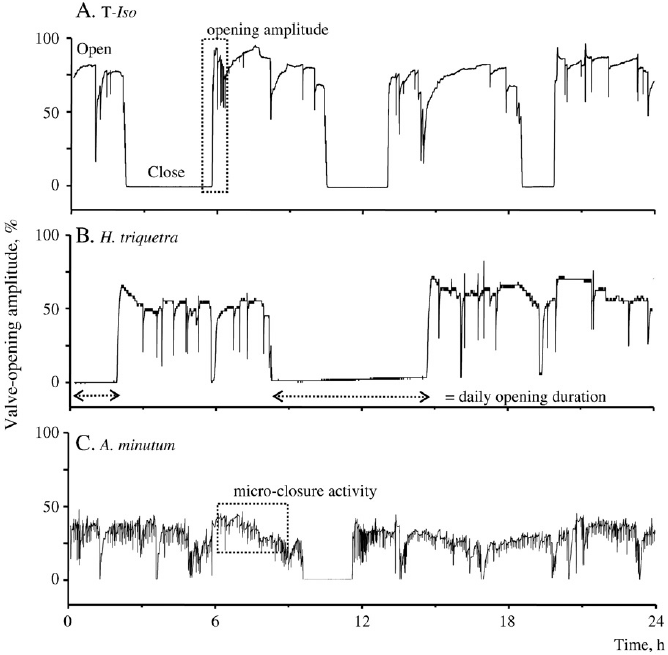
Biological rhythms Barcoding at daily scale To model the valve movements and look for rhythms, we transform the open/close activity of each individual as a series of straight black and white lines (barcodes). On the right, we stack barcodes from 12 oysters studied in Brittany (France) to have a global view of their daily behavior (4 Sept. 2011). Light blue means open, dark blue means close. To better understand the behavior behind these barcodes, we plot them side by side with the photoperiod and the tidal cycle. |
 |
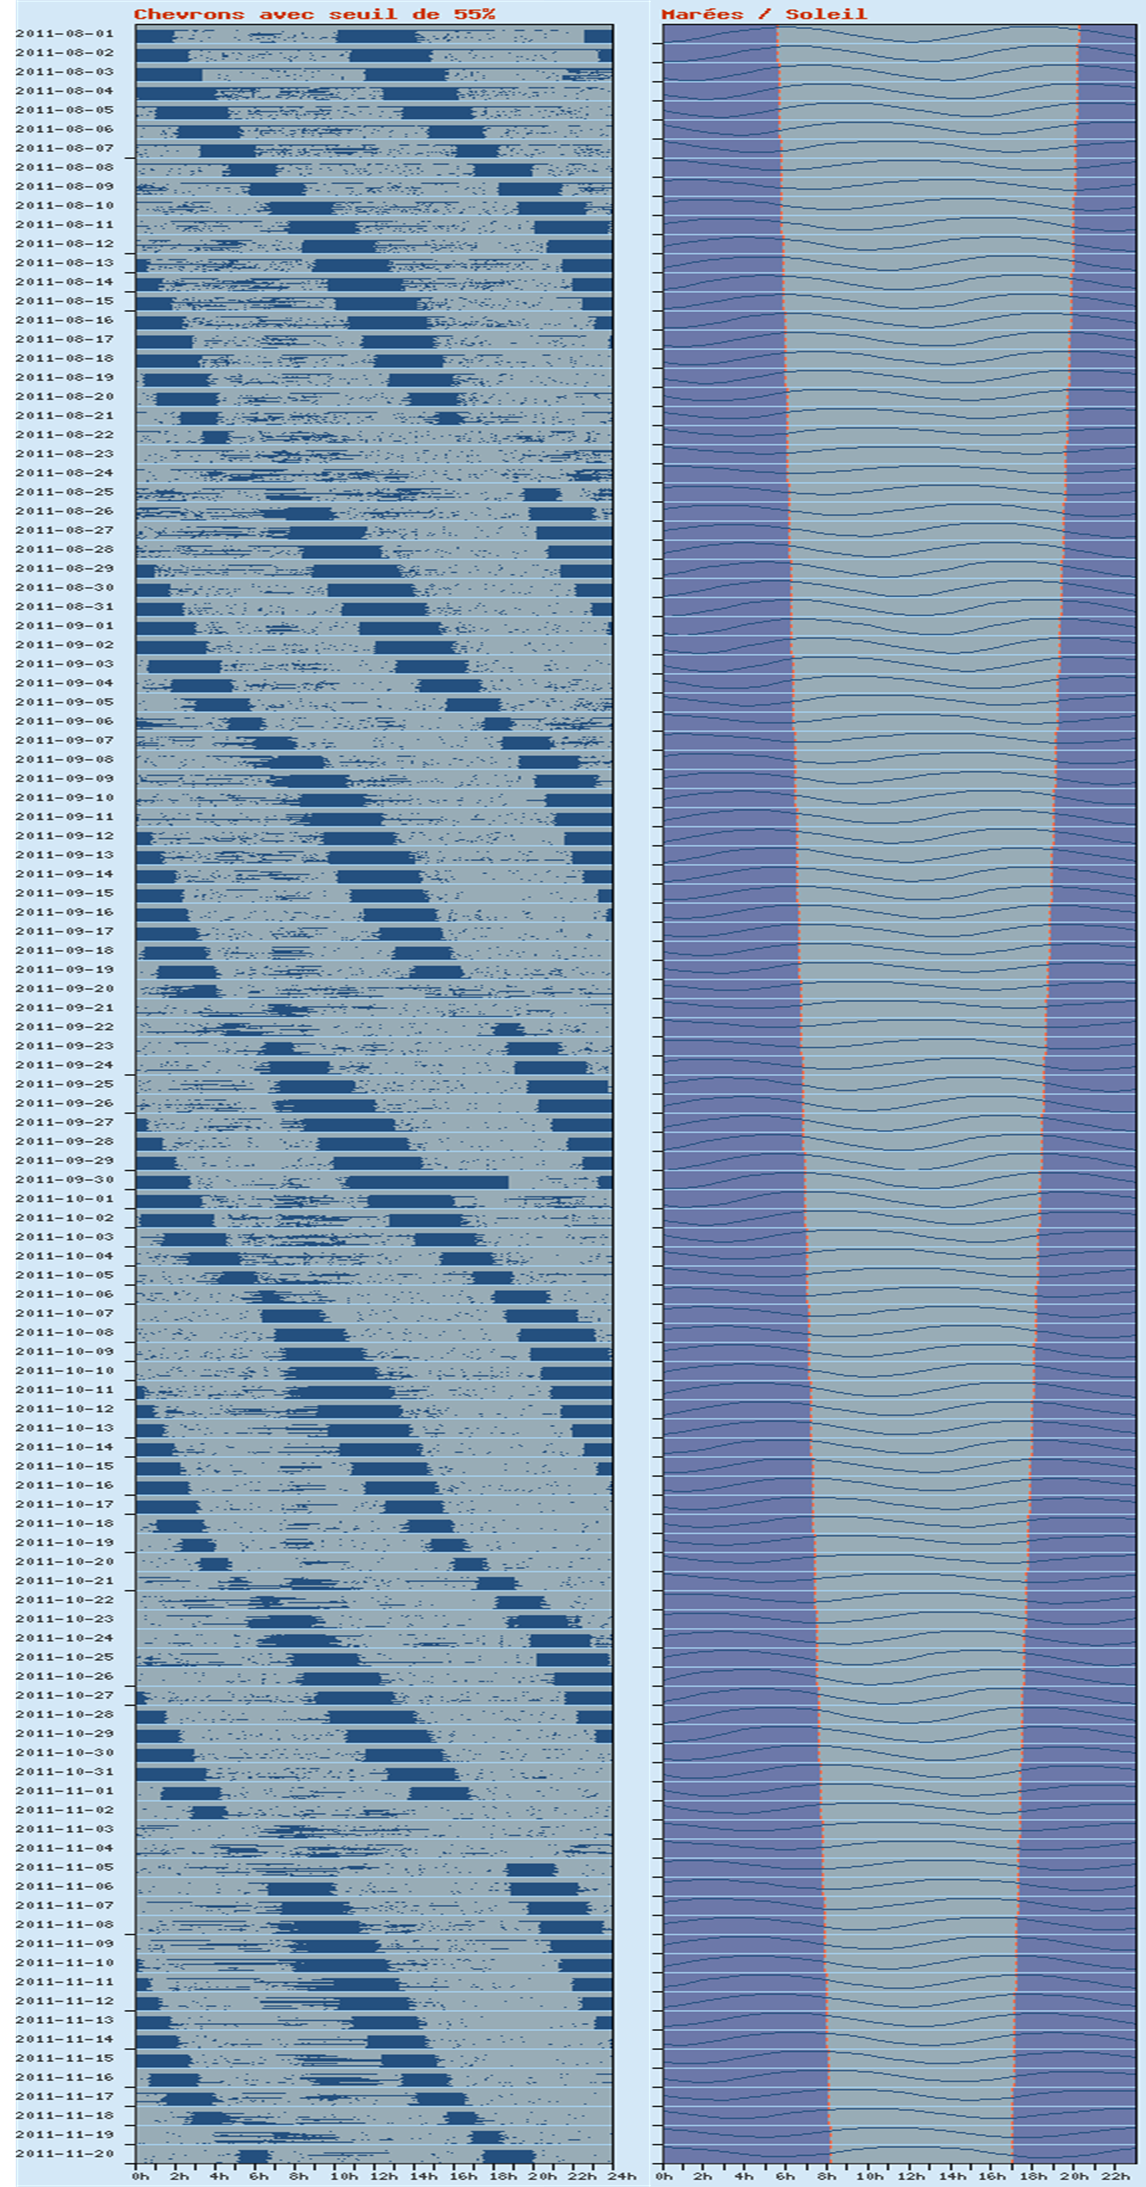 |
Barcoding at monthly scale We stack barcodes for each month to have a global view of the group behavior at larger scale. This can be done for years. Here, a 4 month record from early August to late November 2011. Recorded in a group of oysters living in Brittany, in the intertidal zone (photo gallery). The daily drift is evident as well as the influence of tidal height that is the neap/spring tidal cycles. If one look to the transition from night to day on the right panel and then look at the left panel, one can also see a circadian rhythm of transient closings More informations in Tran et al, 2011, Chronobiology International, 28(4) 307-317 ; Mat et al., 2012, 29(7) 857-867; Mat et al., 2014. Mar. Biol. 161: 89-99.
Applications. To follow the proper expression of biological rhythms is a very sensitive tool to perform a daily follow up of industrial sites' activity in coastal areas. We provide real-time data through a GPRS-based communications system (to know more). Today, we have produce reference patterns in various places ranging from western Europe, to Arctic and Tropics.
|
|
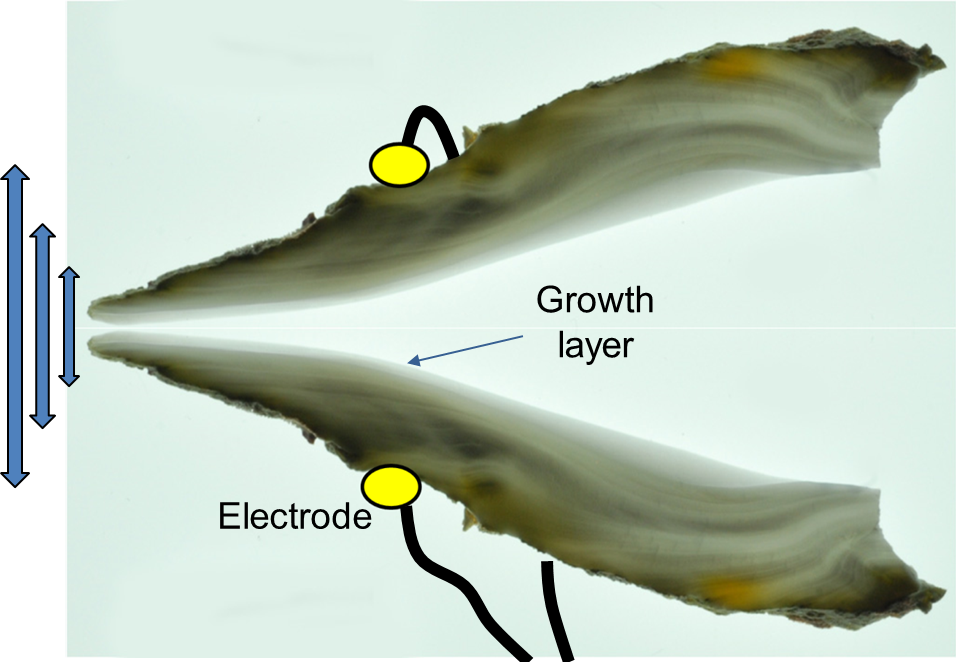
Growth rates Principle Shell growth in bivalve, (calcification) takes place in the mantle cavity, all over the shell internal surface. Every time a growth layer is produced, the minimal distance between electrodes increases. Every day we isolate these minimal distances to draw growth lines. For each site, the graphs are automatically updated and produce daily. Today, we have produce reference patterns in various places ranging from western Europe, to Arctic and Tropics. |
 |
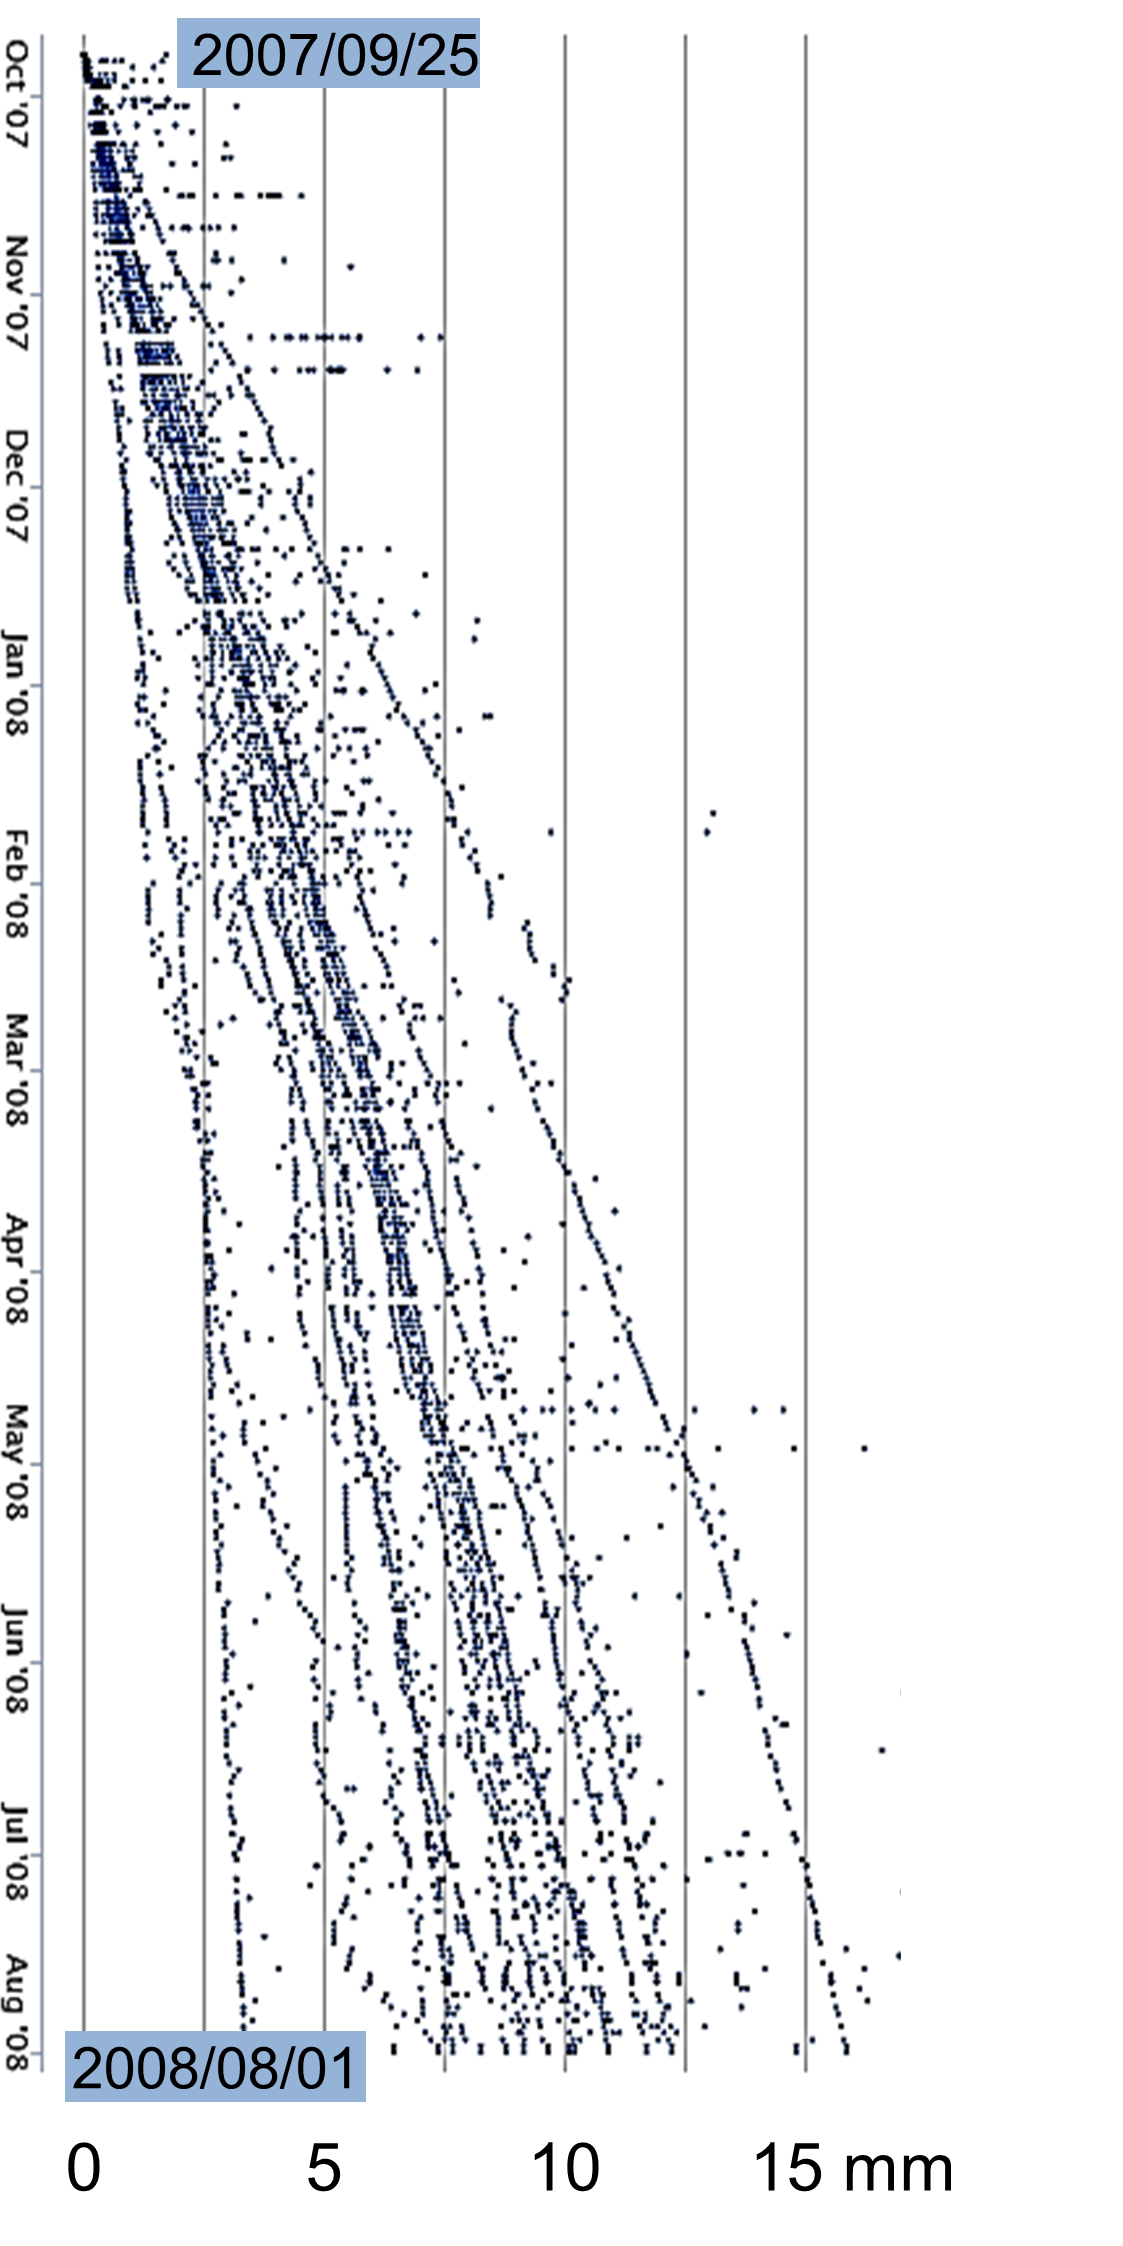 |
One year of growth rate in a group of 16 giant clams located on an isolated reef in the Southern lagoon of New Caledonia. The life history of 15 giant clams, Hippopus hippopus, was studied in situ in the southern lagoon of New Caledonia (photo gallery) from September 2007 to August 2008; growth rate and animal behavior were studied both by sclerochronology and high-frequency noninvasive (HFNI) valvometry. The cumulative growth using both techniques was similar, as was the mean daily thickness increment. The occurrence of one increment per day in H. hippopus shell was measured by valvometry. Shell growth was significantly correlated to rising sea surface temperature (SST), up to 27°C. At the solar maximum, gaping behavior and increment thickness became erratic. SST- and solar irradiance–related stress could be related to physiological oxidative stress triggered by zooxanthellae symbionts. In the present context of globally increasing SST, our data indicated that the giant clams H. hippopus could live beyond their thermal comfort limits in summer in New Caledonia. For more informations Schwartzmann et al, 2011, Limnol Oceanogr. 56(5), 1940-1951
Application. For the tropical belt, that is a fundamental observation about how to perform a sensitive daily follow-up of mining sites' activity and providing real-time data through a GPRS-based communications system (to know more).. |
|
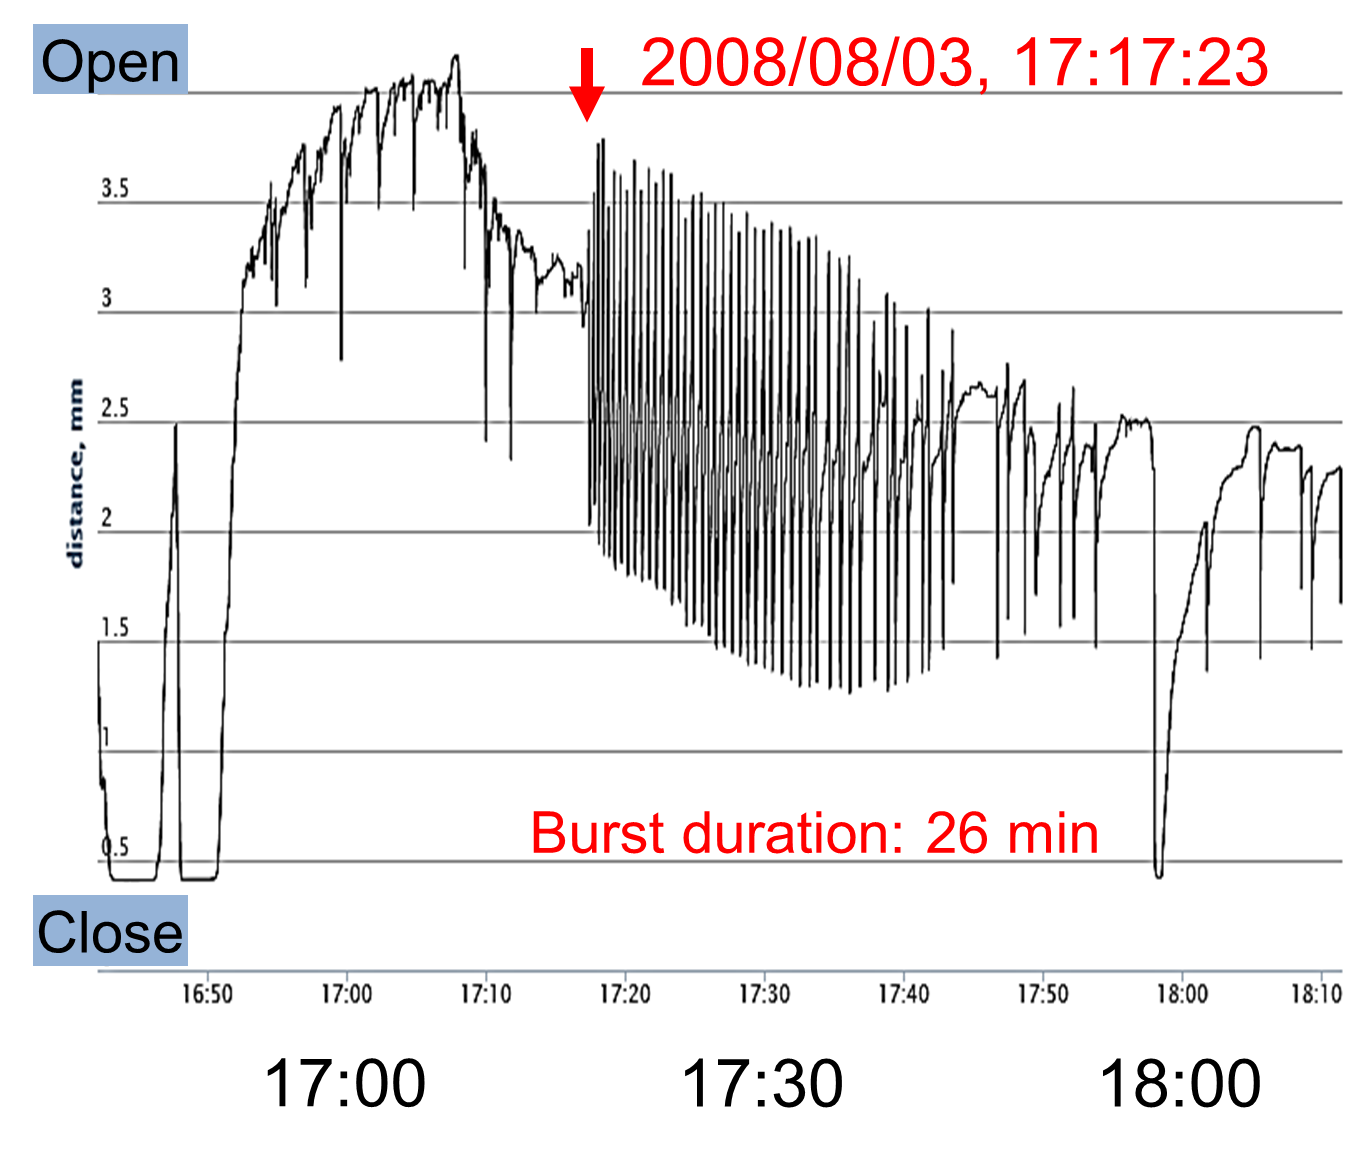
Life and Death Bivalve spawning and new life begins Spawning is a very short and critical event within a year. But it is a very susceptible part of the life cycle needed to estimate population health. We record and date these events. Right panel, the spawning of a female pacific oyster Crassostre gigas which happened on August 3rd, 2008 at 17:17 UTC in the Bay of Arcachon, France (photo gallery). The entire duration was 26 min. Today, we have produce reference patterns in various places ranging from western Europe to Arctic. To know more: Bernard et al. In situ spawning in a marine broadcast spawner, the Pacific oyster Crassostrea gigas: Timing and environmental triggers. Limnol. Oceanogr. 61: 635-647 open access |
 |
|
Life ends: the death
|
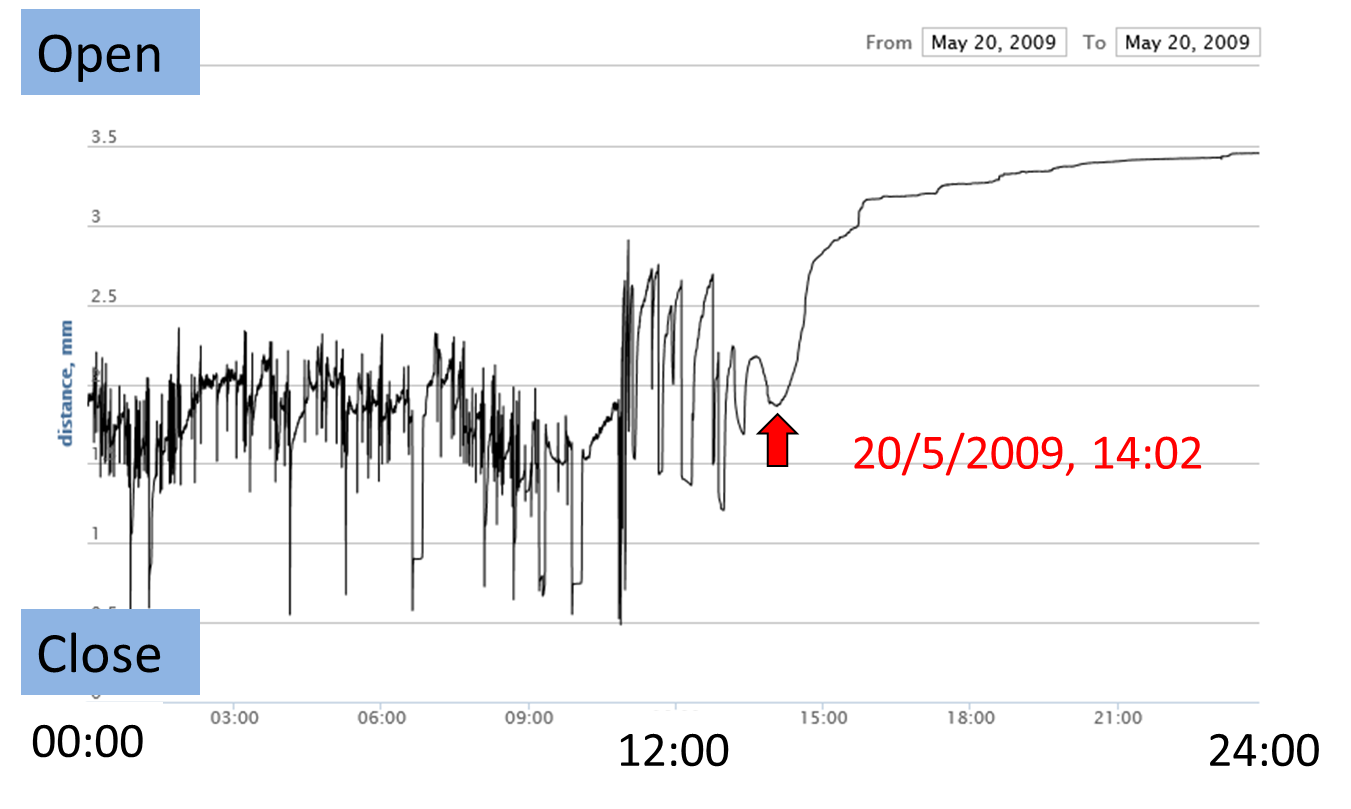
Death is the cessation of all biological function. In bivalve we define death as a point in time at which the adductor muscle(s) stops working. On our records it is rather simple to characterize. The valves become motionless leaving a large gaping opening and there is no more active movements. On the left, this oyster died on May 20th, 2009 at 14h02 Interestingly, the bivalve behavior before death is very typical. Seeking the last moments it was normal and rhythmic can tell when the animal started to be disturbed. If a whole group starts to be disturbed in a similar timeframe, one can speculate that a common drive does exist. Evidently, it can be a drastic, or subtle but deadly, change of water quality. |
|
|
Conclusions We develop a new tool in marine ethology and ecotoxicology to perform remote biomonitoring. It works online and collect vast amounts of informations daily published in easy to read graphics. The project provides basic facts and data for decision making and help minimize environmental degradation. Since 2006 we acquired knowledge and know-how from the Far North / Arctic to the Tropics with different species: oysters, scallops, mussels and giant clams. Our goal is to acquire basic knowledge but also to help document the world’s Ocean changes and to have a positive impact by allowing sharing of informations with public and pro. |