|
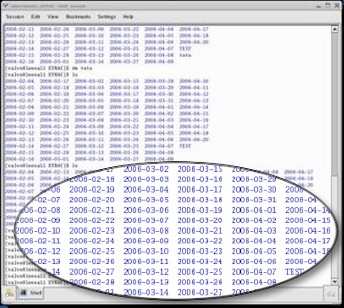
For each of the 16 animals, a recording is composed of a series of data points. Each point is defined in the plane by:
Currently, one measurement is carried out every 0.1 sec. With 16 oysters each animal is questioned every 1.6 sec and each day a data matrix of 864 000 lines (1 728 000 measurements) is collected. |
|
 |
 |
|
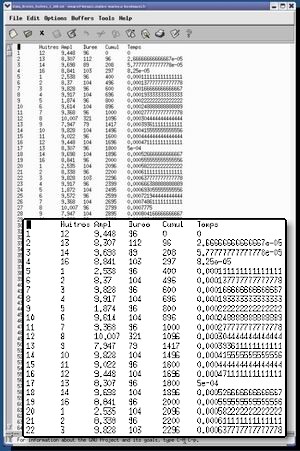
Finally, for each oyster, 54,000 couples of values (108,000 measurements) enable us to describe the animal behavior ! And each day, the accumulation process goes on... |
|
One can already observe some phenomena and tendencies in the scatter plot representation (see the Recordings Web page). For instance, it is exceptional that oysters remain open all the day. But the human brain is in few days clearly completely unable to describe, integrate and ''digest'' this huge volume of information. |
|
| Consequently, as such the data are not very exploitable. To cope these difficulties, we have decided to model and handle them statistically. The idea was to transform the collected sample, by animal, in a mathematical equation. This mathematical modelling equation enables us to extract a maximum of ''pre-digested'' values treated statistically over the day, the week, the month or the year. It illustrates the importance of mathematic into a multi-field approach combining ecotoxicologist and electronician. Finally, the determination of the mathematical model will enable us to describe and understand the behavior of these animals in situ. For instance, the number of times that an animal makes small movements of closing (impossible to count manually on large volume of data), can be considered as characteristic of a febrility state. This could be comparable with the fact to pass the tongue on the lips in a repetitive way or with the way a dog breaths the air while seeking from where an odor comes (it is to the biologist to discover why oysters can become ''feverish''!). |
|
Principle of the mathematical analysis: |
|
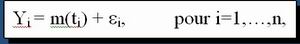
The computations were performed under Linux system (version Fedora 4) on a biprocessor xeon workstation DELL (3.06 GHz). To model the oysters behavior, we used a nonparametric regression model based on kernel estimator (Silverman (1986), Härdle (1992), Durrieu (1997ab, 1999), Tran et al ., (2003) and Durrieu et Briollais (2006)). The regression model is: |
|
 |
|
where n, Yi , ti and m(.) denote respectively the sample size (total number of couples of values), the distance between the 2 electrodes, the GMT time and the unknown regression function to be estimated. The variation ?i is a random variable with a mean value equal to 0 and the stochastic distribution f of these random variations allows to characterize the variation of the random variable Y around |
|
 |
|
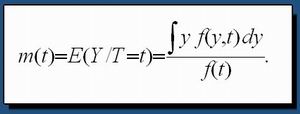
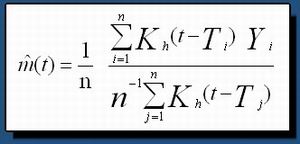
The distribution f is typically unknown and is unlikely to follow any familiar distributions, such as the normal distribution. Hence, no distribution is assumed. This average function m() (definition of the conditional expected value of Y given T) depends on the unknown joint distribution function of (Y,T), denoted by f(y,t) and on the unknown distribution function T denoted by f(t). The problem is thus to estimate the function m(.) conditioned by the measurements with respect to the time of experiments. Based on kernel estimators of the 2 distribution functions, the estimator of m() describing the behavior of an animal is given by |
|
 |
|
|
|
The consideration of these statistical models has in fact required the construction of optimized algorithms to avoid important computations times generated by the large volume of data to treat (each data file represents 18 M bytes per single day). In term of environmental protection, during a pollution, variations of one or several parameters of the animal behavior will appear. This type of analysis will thus help us to better understand and interpret the impact of a toxic in the aquatic systems being under the molluscans eye. |
|
|
|
|
|